I enabled Google Analytics on October 21, 2006, roughly a year after I started using Shaun Inman’s real-time (yet infrequently updated) Mint software. Both packages are part of my daily routine to see what is going on with the site, but I’ve rarely used them for more than understanding the basics: How is this article tracking? Who is talking about it? More recently, I’ve started to use the Chartbeat package, a solid combination of what I get out of Mint and the real-time portion of Google Analytics.
With the quiet of the holiday season, I wanted to take a step back and analyze a question I’ve had for years: should I be writing less… more? I’m averaging around two articles a month and the trend is that the articles are getting longer and slightly less frequent. My question was: how was this trend affecting my traffic? Thanks to years of analytics and my obsessive nerd tendancies, I can start to consider these questions:
The following is a graph with two Y-axis: the left axis includes total page views, visits, and uniques. While I’ve obscured the detailed totals, for context, in 2012 I did ~ 1.2M page views. The right axis and the red bars represent the number of articles published in that year. Again, for context, this is the 20th piece published in 2012.
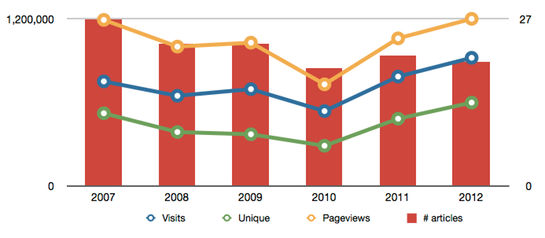
To my surprise, for the first four years I was keeping regular stats, my traffic was shrinking. I had no idea. At a glance, it looks like the trend downward is related to the number of articles, but in 2011, the traffic picked up even though I was still writing less. This trend continued in 2012 when I wrote the least amount in terms of number of articles, but had the best year in terms of traffic. Further investigation is warranted.
2007 was the debut of The Nerd Handbook and if there was ever an article that defined this site, it was this piece that explained to the significant others of nerds what the situation was with all the nerdery. A Glimpse and a Hook was in the sidebar for years (and only recently replaced by Bored People Quit) and stood out as practical and usable advice for your resume. (For the record, resumes are dead, we’re just in denial) N.A.D.D., a piece I wrote in 2003, took the #3 spot in 2007 and is testimony to how much ongoing traffic you can garner with a single popular article. #4 was the debut of The Button continuing my “Looking for a new Gig” series. Finally, The Gel Dilemma, my obsessing about gel pens, took the #5 spot.
In 2008, a year I now see was a traffic down year, the top 3 pieces were articles I’d written the past year: The Nerd Handbook, Glimpse, and NADD represented 20% of page views in 2008. Two new articles broke the top 5: Out Loud was my first piece on developing presentations (and my love of Keynote). Horrible was my explanation of the futility of improving yourself where you were legitimately impaired.
In what will be a recurring theme, The Nerd Handbook returned in the #1 spot in 2009. It was a year where traffic losses appeared to stabilize. Glimpse returned in #2, but The Words You Wear was a new piece that continued my war against managementese. Gaming the System was my first foray into applying ideas of gamification into shipping software. The Maker of Things – a love note to the Brooklyn Bridge – was #5 on the year and remains one of my favorite pieces that I’ve written.
2010 was a down year. I haven’t looked at the detail traffic stats as I type this, but based on history, I’d guess that the top 5 was dominated by existing pieces. Odd, I’m wrong. The Nerd Handbook remains in #1, but #2 was the arrival of a popular piece – How to Write a Book – which explained the final days writing Being Geek. At #3, The Update, the Vent, and Disaster documented my experiences with running 1:1s. Glimpse dropped to #4 and #5 was my treatise on How to Run a Meeting. What is unique about 2010 is the number of articles I wrote was down and you’d think that was why traffic was down, but, as you’ll learn, you’re wrong.
2011 was the first year since 2007 that the #1 spot was replaced. Bored People Quit garnered Nerd Handbook-type traffic. Nerd Handbook remained steady in the #2 spot followed by How to Write Book. You are Underestimating the Future was my goodbye note to Steve Jobs and grabbed the #4 spot which is impressive since it was written late in the year. Managing Nerds which I thought would be Nerd Handbook like, landed in the #5 – less impressive since it had all year to gather traffic.
Traffic wise, 2012 was my best year ever. Like 2010, I wrote 19 pieces (this is the 20th), but unlike 2010, the top 5 were dominated by new content. #1 – Someone is Coming to Eat You was a post-Steve Jobs piece regarding innovation followed by an exploration of hacking in Hacking is Important. #3 continued my innovation exploration in Innovation is a Fight with an analysis of the departure of Scott Forstall from Apple whereas #4 was a plea for folks to Please Learn To Write. #5 was A Design Primer for Engineers, again, the first piece of the year that I expected to fare better.
If you look at total traffic for the past six years, the articles you’d expect are the leaders. They’re the ones in the right bar because they’re the ones that continue to resonate and therein lies the answer to my question. The interesting aspect of traffic to me is to understand: was what I wrote valuable?
I scratch my link blog itch with Twitter, I share my travels with Instagram, but here – I continue to learn how to write.
Thank you for reading and Happy New Year.
5 Responses